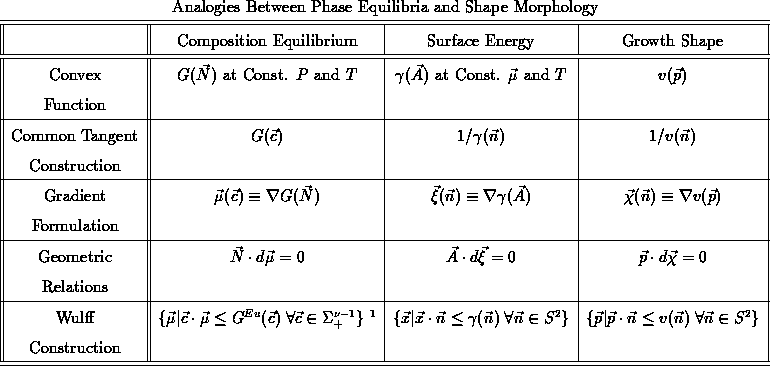

In this paper we have examined how the three topics to which Hubert Aaronson has contributes so much, phase equilibria, shape equilibria, and limiting shapes obtained with interface controlled growth, share a common mathematical basis, which is that in each case there are HD1 functions that are to be convexified. Because these topics have had separate developments, there are many methods that have been found useful in some but not all of the topics. These fall broadly into three areas as summarized in Table 1:
For the and
plots the locally convex surfaces of the
``ears'' beyond these intersection represent metastable phases or
surfaces; all other parts of the ears are separated from the
metastable parts by spinodes and represent unstable phases or
surfaces.
There is no clear cut stability criterion for the characteristics; any characteristics can be stable at some time during shape evolution with arbitrary initial data. However the limiting shape of an outward growing crystal is the innermost plot, i.e. the plot without the ears.
The common mathematical basis has indeed made it possible to examine
the analogies for all three topics and for all three basic methods.
The differences in methods, such as common tangents on radial plots of
versus
, were often the result of the differences in the
metrics in conventional use. Manhattan metrics work with the function;
Euclidian metrics with the reciprocal. If we use a weighted metric
for
, such as energy/(unit area) projected along an axis,
, the tangent constructions are done on this rather
than its reciprocal. This metric is already in use for vicinal
surfaces. Molar and molal free energies are convexified directly with
equivalent results. The standard Wulff construction works with the
Euclidian metric, and neither molar or molal free energies are easily
used. But with the definition of a Euclimolar free energy we can directly
create a
graphically, without taking derivatives of
or
.
The analogies create many approaches for solving problems in all three topics. The advantages of having such flexibility in approach need to be explored. [44]
Phase diagram data are easy to obtain experimentally and can be obtained
without knowing the free energy. Such data can be extrapolated. The
topology of phase changes is guided by the phase rule; such phase
changes appear on phase diagrams in standard formats. The same holds
true for -diagrams; the orientation of smooth surfaces and the
orientation gaps at edges and corners which develop at local
equilibrium, i.e., without waiting for full shape equilibration or without
measuring
. From such data the
-diagrams can be constructed and
extrapolated, identifying surface ``phase changes'' that conform to a
phase rule that is modified for crystal symmetry. We have in an
example [54] exploited this interconversion between shapes and
phase equilibria to analyze a complex series of phase changes in a
ternary regular solution.
All the information that is in is not only in
, but also in
the
plots; the free energies can be recovered from such a
plot.
The same interconversion holds for the chemical Wulff plots and the
convexified free energies. These plots all display the same
information, but in different formats. Furthermore some plots are more
sensitive to errors in the data because differentiation or finding the
point of tangency is involved. Which plot is best will be partially
determined by the nature of the data; chemical potential data ought to
go directly into constructing a
-plot. Free energy plots
show
free energy and composition, but coexistent compositions must be
determined by a tangent construction that is very sensitive to errors in
the data and becomes increasingly difficult with increasing number of
components. The Wulff shape is obtained without differentiating the
free energy data; the
shape requires taking a gradient of
.
These two plots should be congruent for the stable equilibria. They
display phase coexistence clearly as corners and edges, compositions
as normal directions, which implicitly requires differentiation, and
free energy of a particular composition as the distance (in the
appropriate metric) of the corresponding tangent plane from the origin.
The analogies are not perfect, as a few examples will show. The
stability criteria are different for the kinetics. Curved surfaces
can be part of the Wulff shape, and thus of an equilibrium shape.
Only points in the -shape represent equilibria. Curved
surfaces
in this shape are ranges in the
and in the compositions. A
system that spans such a range is not in equilibrium and has real-
space gradients of the chemical potential. While there is a clear
analogy with edges and corners, there appear to be no chemical analogy
to a triple junction of surfaces.