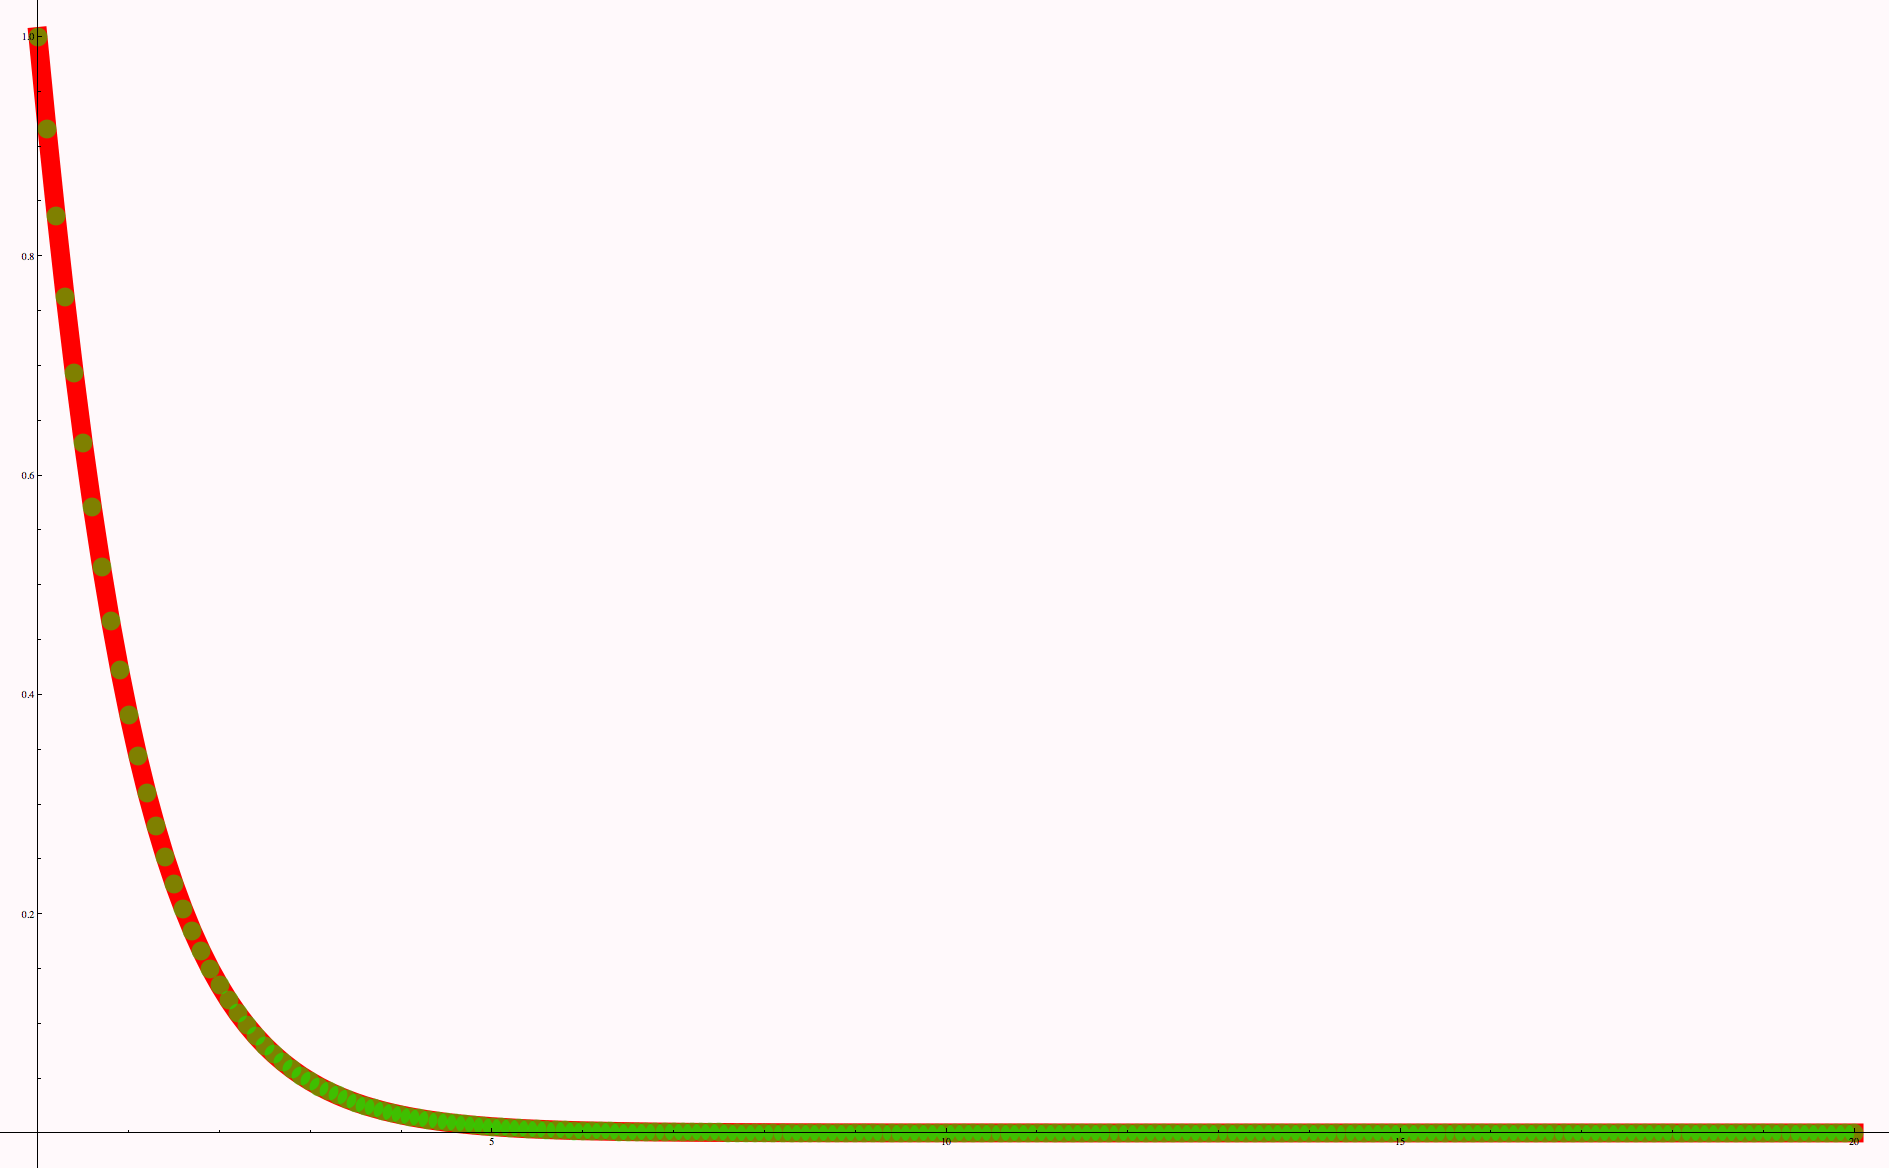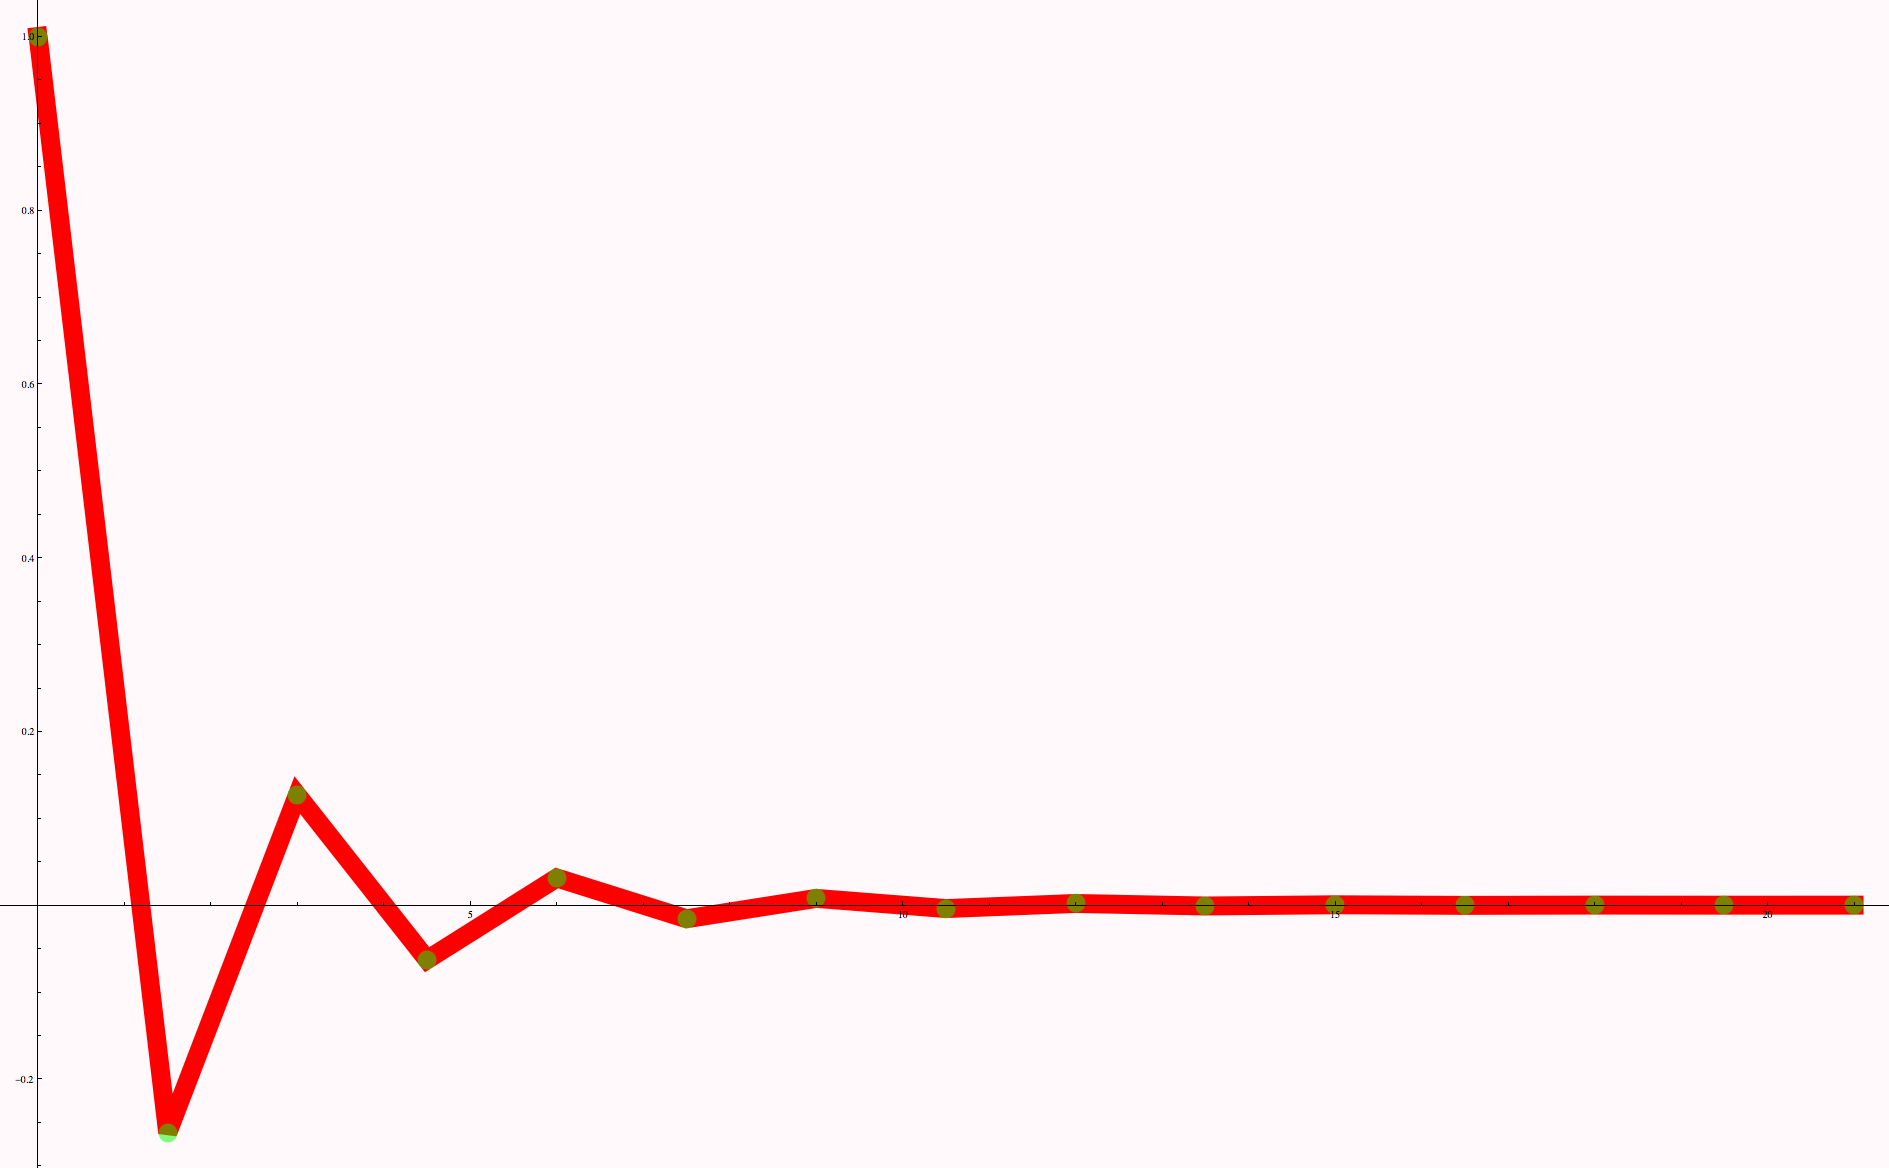
Visualizing Trajectories from the Explicit Forward Differences Method
A Function PlotM1, taking arguments for α and initial condition is used with NestListWhile and ListPlot to produce graphics with a red line and green points.

![]()

![]()

| Created by Wolfram Mathematica 6.0 (06 November 2007) |