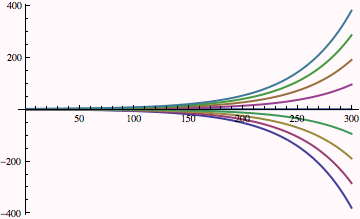
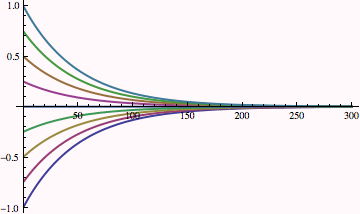
Visualizing Trajectories: Initial Conditions Define a Set of Curves that "Cover" the Plane.
Plotting a bunch of curves for the same positive α value, but each corresponding to a different initial value, demonstrates that a point in space "belongs" to a curve. Here we make a function to demonstrate for a range of inital values and a function of α
![]()

Making a similar plot for a family of curves corresponding to a negative α value
![]()

| Created by Wolfram Mathematica 6.0 (06 November 2007) |