Visualizing Atomic Densities
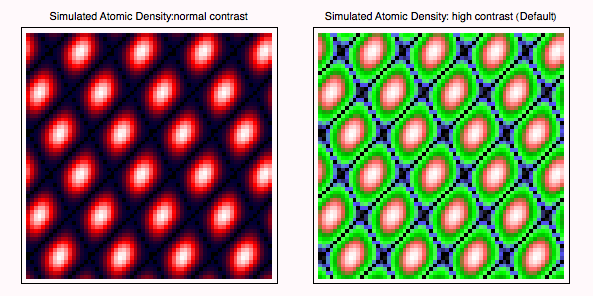
ImagePlot will be our "work-horse" function to dispay images, as well as Fourier data. It takes an rectangular array of data as input, and has thee optional arguments for a plot-label, the colorfunction to use (i.e., highcontrast or normalcontrast), and an indication of the image size.

Here we show the normal contrast and the highcontrast images of the simulated atomic data side-by-side.
![]()
![]()

| Created by Wolfram Mathematica 6.0 (01 November 2007) |