Frivolous Example: Beautiful Data are in the Eye of the Beholder
Import some random intensities that we have collected off the web:
![]()

Let' s image that data with ArrayPlot
![]()

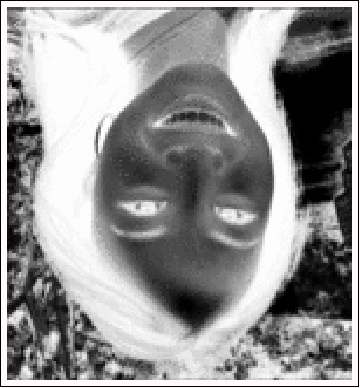
Oops, it' s upside down and inside out.
![]()
![]()
Let's rescale the image to fill out the full intensity range and flip it into a more recognizable orientation.
![]()

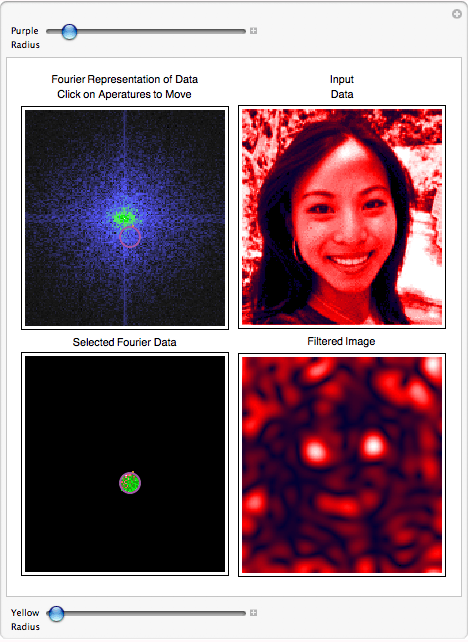
Let's view the data in real space and diffract it.
![]()

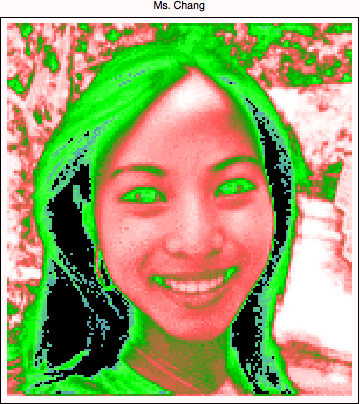
This is so much fun. Let' s make the image have much more contrast ....


| Created by Wolfram Mathematica 6.0 (01 November 2007) |