Scalar Potentials: Their Gradient Fields and Visualization
Setting up the combined potential due to three point potentials as an example to visualize gradients, divergences, and curls
![]()
A field source located a distance 1 south of the origin
![]()
Sources located distance 1 at 30° and 150°:
![]()
![]()
Function that returns the two dimensional (x,y) gradient field of any function declared a function of two arguments:
Generalizing the function to any arguments:
![]()
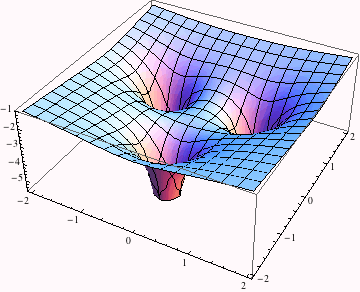
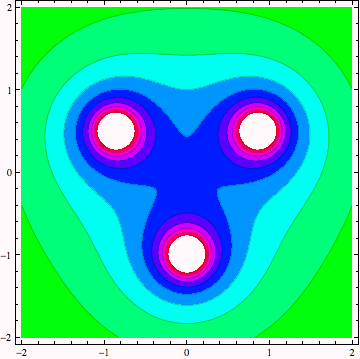
The sum of three potentials:
![]()
f(x,y) visualization of the scalar potential:

Contour visualization of the three-hole potential

| Created by Wolfram Mathematica 6.0 (21 September 2007) |