Interactive Visualization of a Approximations to Different Points on a Surface.
Example function of two variables:
![]()
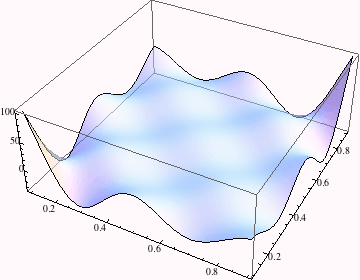
Plot this function over suitable range of the variables x and y:
![]()

Now, approximate the function about a specific point (xo, yo), using Mathematica's Series function (this is now a function of four variables)
![]()
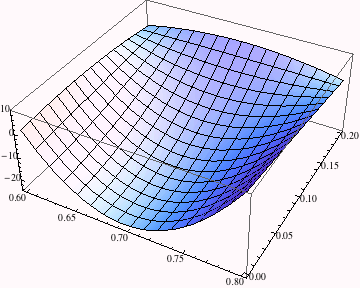
and plot the approximate function in the neighborhood of (xo, yo):

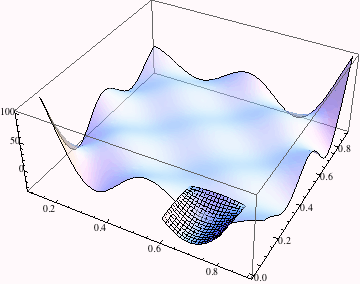
Both the original and the approximate function can be plotted simultaneously:
![]()

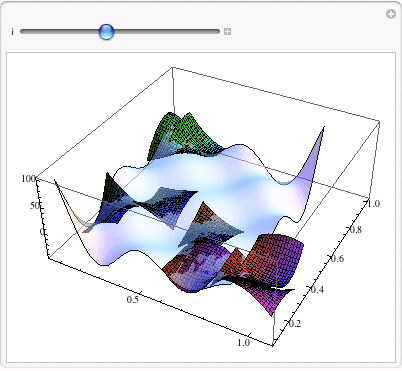
This final little bit selects random points (xo, yo) and fits Taylor expansions at different points, then displays them individually as well as with a superposed plot of the original function. Here we fix the evaluation points randomly.
![]()
The next function automates the small approximating surface patch
To build a sequence of graphics, I'll build a stack of ten graphics objects by using a recursive method. The next command sets the end of the recursion loop.
![]()
Here is the recursive function.
![]()
![]()

| Created by Wolfram Mathematica 6.0 (20 September 2007) |