Visualizing Local Tangent Vectors of Space Curves
Compute the local derivative of the vector that we visualized above: ![]() =
= ![]()
![]()
![]()
Write out a function for the derivative:
![]()
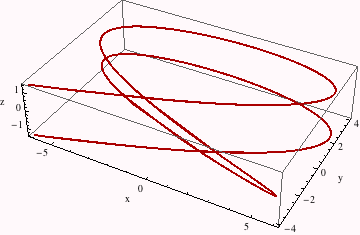
Plot it.... Note that it doesn't "appear" to be periodic, which would be wrong.
![]()

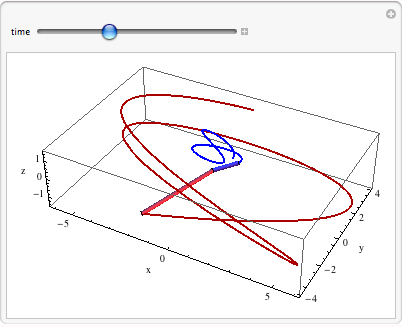
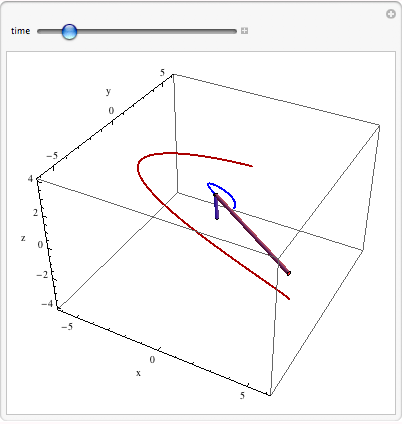
The puzzle can be visualizing the time-development of both curves:


To visualize the "tangency property," we translate the derivative-vector to the end of the space curve


| Created by Wolfram Mathematica 6.0 (17 September 2007) |