Visualizing Space Curves as Time-Dependent Vectors
Create a trajectory of a point or a particle
![]()
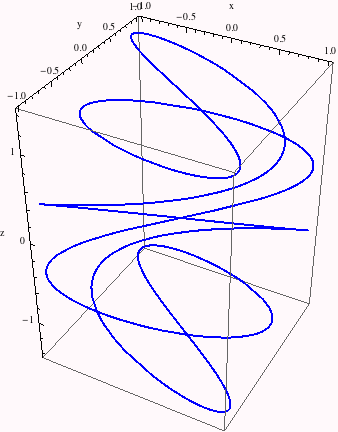
ParametricPlot3D allows us to visualize the entire trajectory at once.

Here is a function to create a graphic with a variable end - point. We will have the function remember when it has already computed a graphic, trading memory for a possible speed-up.
![]()
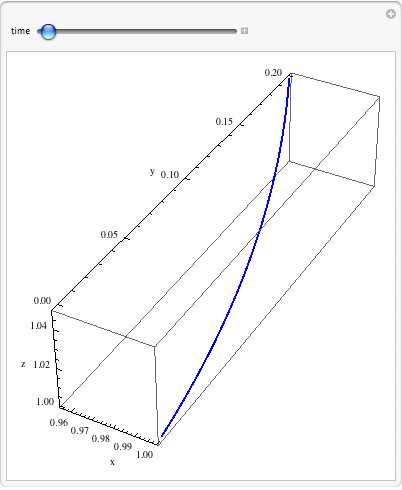
Use manipulate on the graphics function to visualize how the curve develops with its parameter
![]()

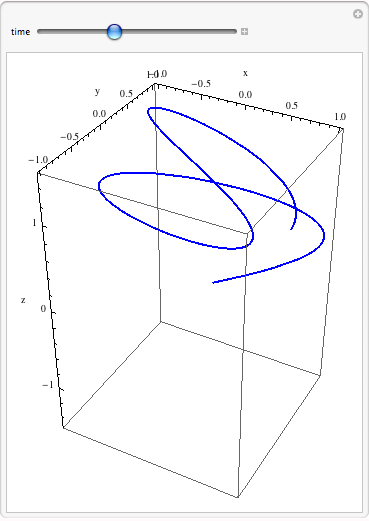
However, we need to fix the length scale between frames, so we use the last graphic to infer what PlotRange should be.
![]()

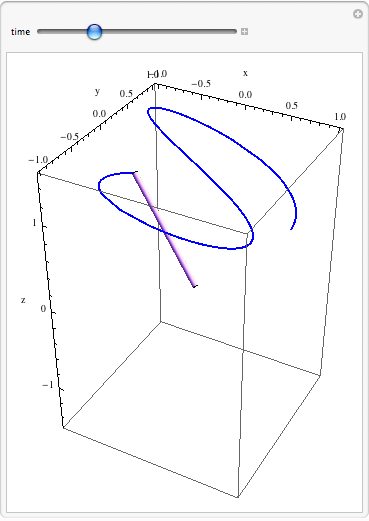
Next, we add a graphic element to show the vector, drawn from the origin, for each end-point.
![]()

| Created by Wolfram Mathematica 6.0 (17 September 2007) |