Representations of 3D: Plot3D
This is a function to give the magnitude of the electrostatic potential at a point x,y,z for a point charge placed at xo,yo.

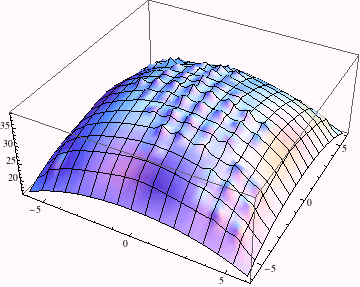
SheetOLatticeCharge represents the electric field produced by an 11 by 11 array of point charges arranged on the x-y plane at z = 0. The following command evaluates and plots the field variation in the plane z = 0.25:

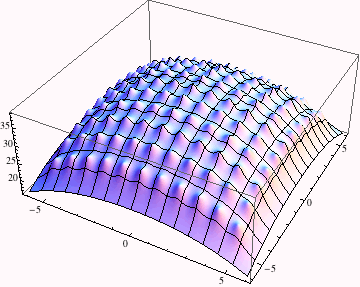
Note below how theplot is set to contain the output of the Plot3D command---it is now a symbol assigned to a graphics object. The number of plotpoints is increased so that we can resolve all the bumps. This will take a while to compute on most machines.


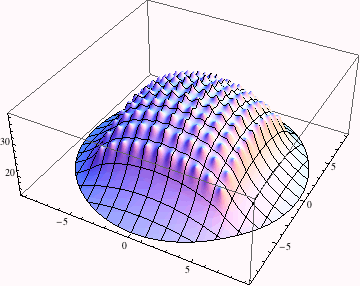
This demonstrates the use of RegionFunction plot option which is pure function. Here, only the region inside a cylinder with radius 9 (![]() +
+ ![]() ≤
≤ ![]() ) is plotted.
) is plotted.


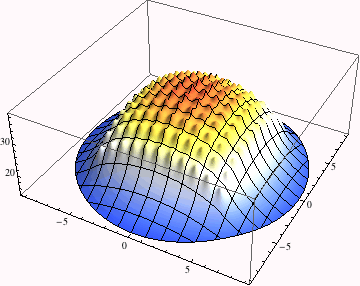
This demonstrates the use of the ColorFunction plot option which is pure function. Here we use one of Mathematica ColorData functions.


| Created by Wolfram Mathematica 6.0 (28 August 2007) |