
Worked Example: Graphical Data Exploring of the Elements
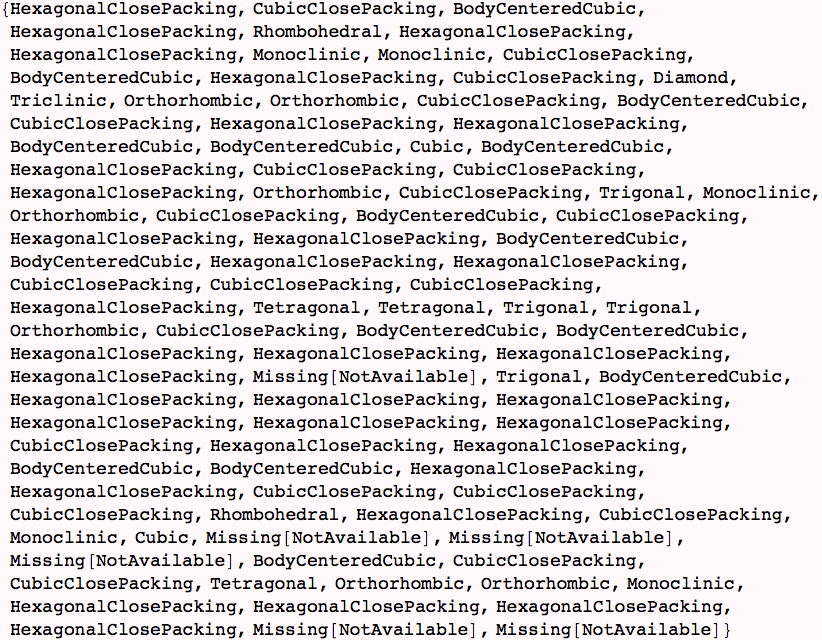
Here we do a small exercise to get a graphical representation of which Crystal Structures the elements form, and represent the frequency of each type. First we create a list of known elemental crystal structures for the first 100 elements.
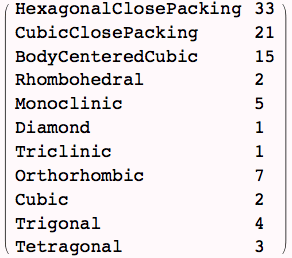
We manipulate our data to remove missing data (using Cases), and then use Tally to find how many times each Crystal structure appears. We assign the results to a varialbe that we can use later to plot.


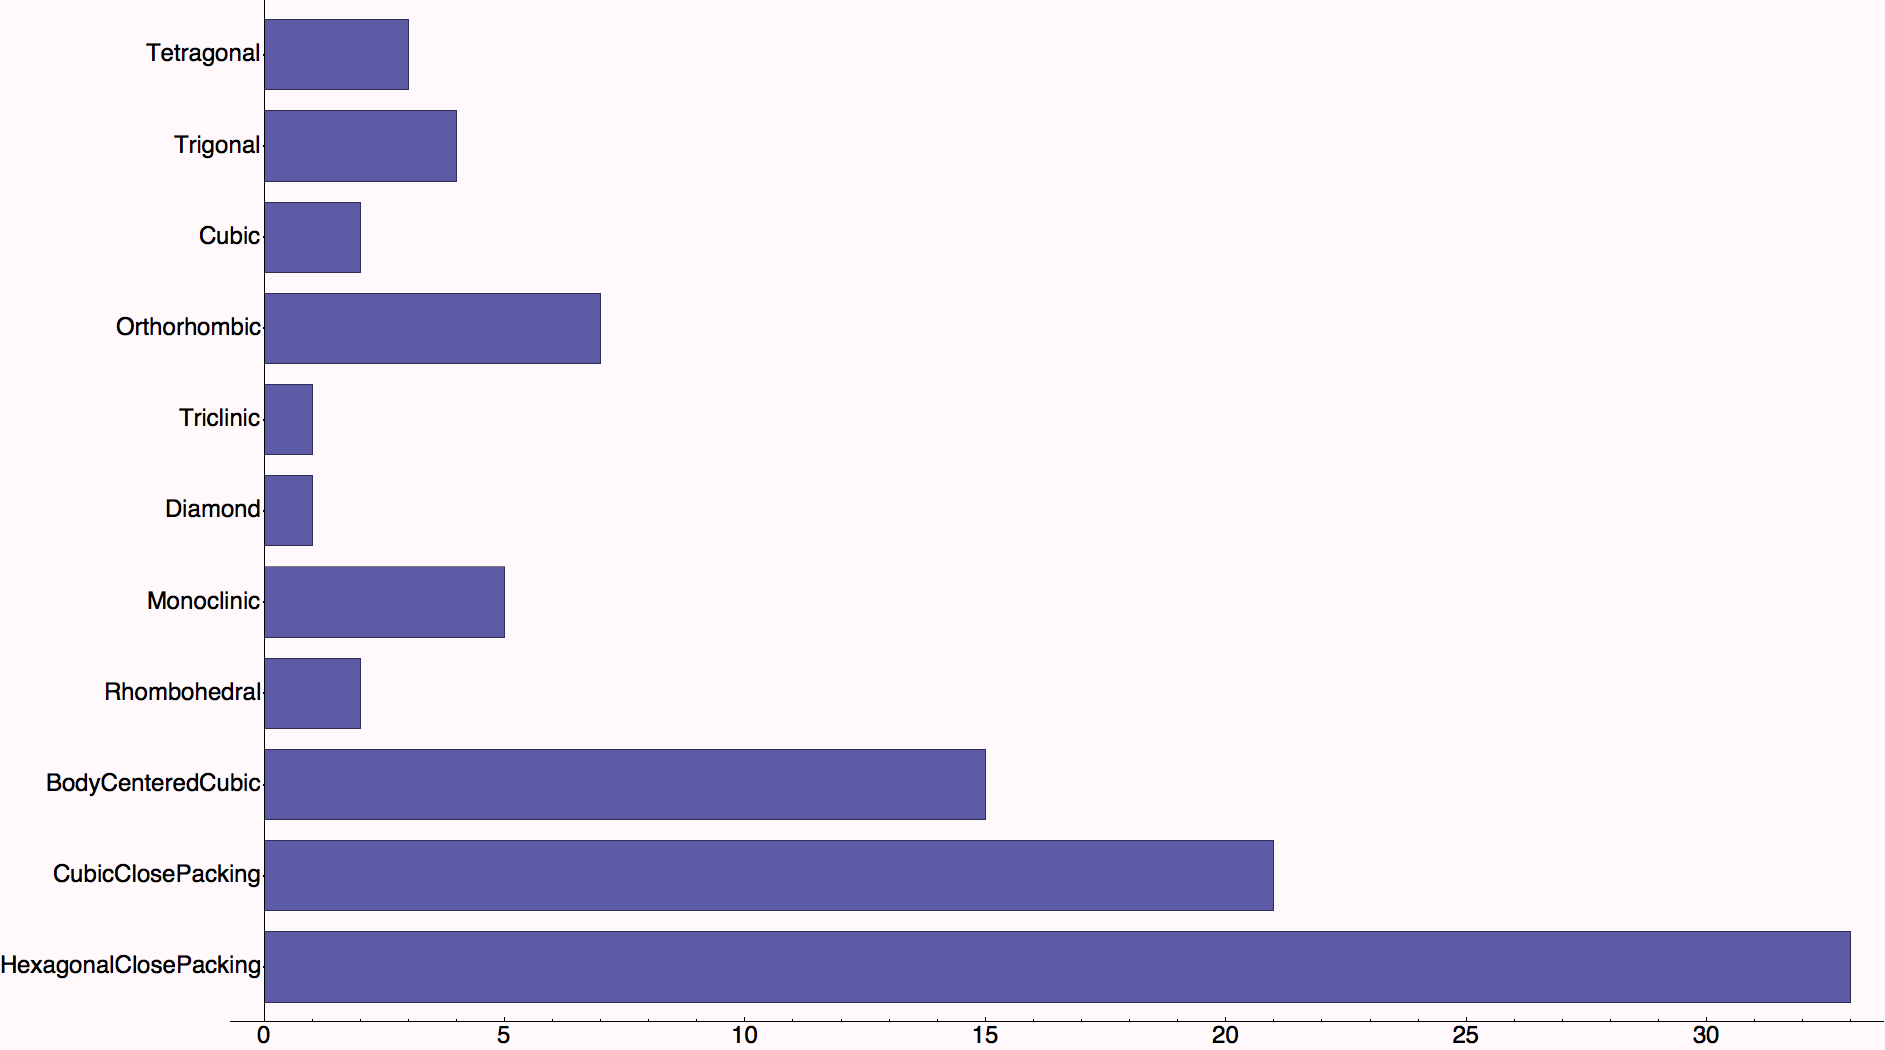
Here is a bar chart showing the frequency of crystal structures. We had to manipulate the data (with Transpose) to get the numbers of each type and to get a list to hand to the Option BarLabels.

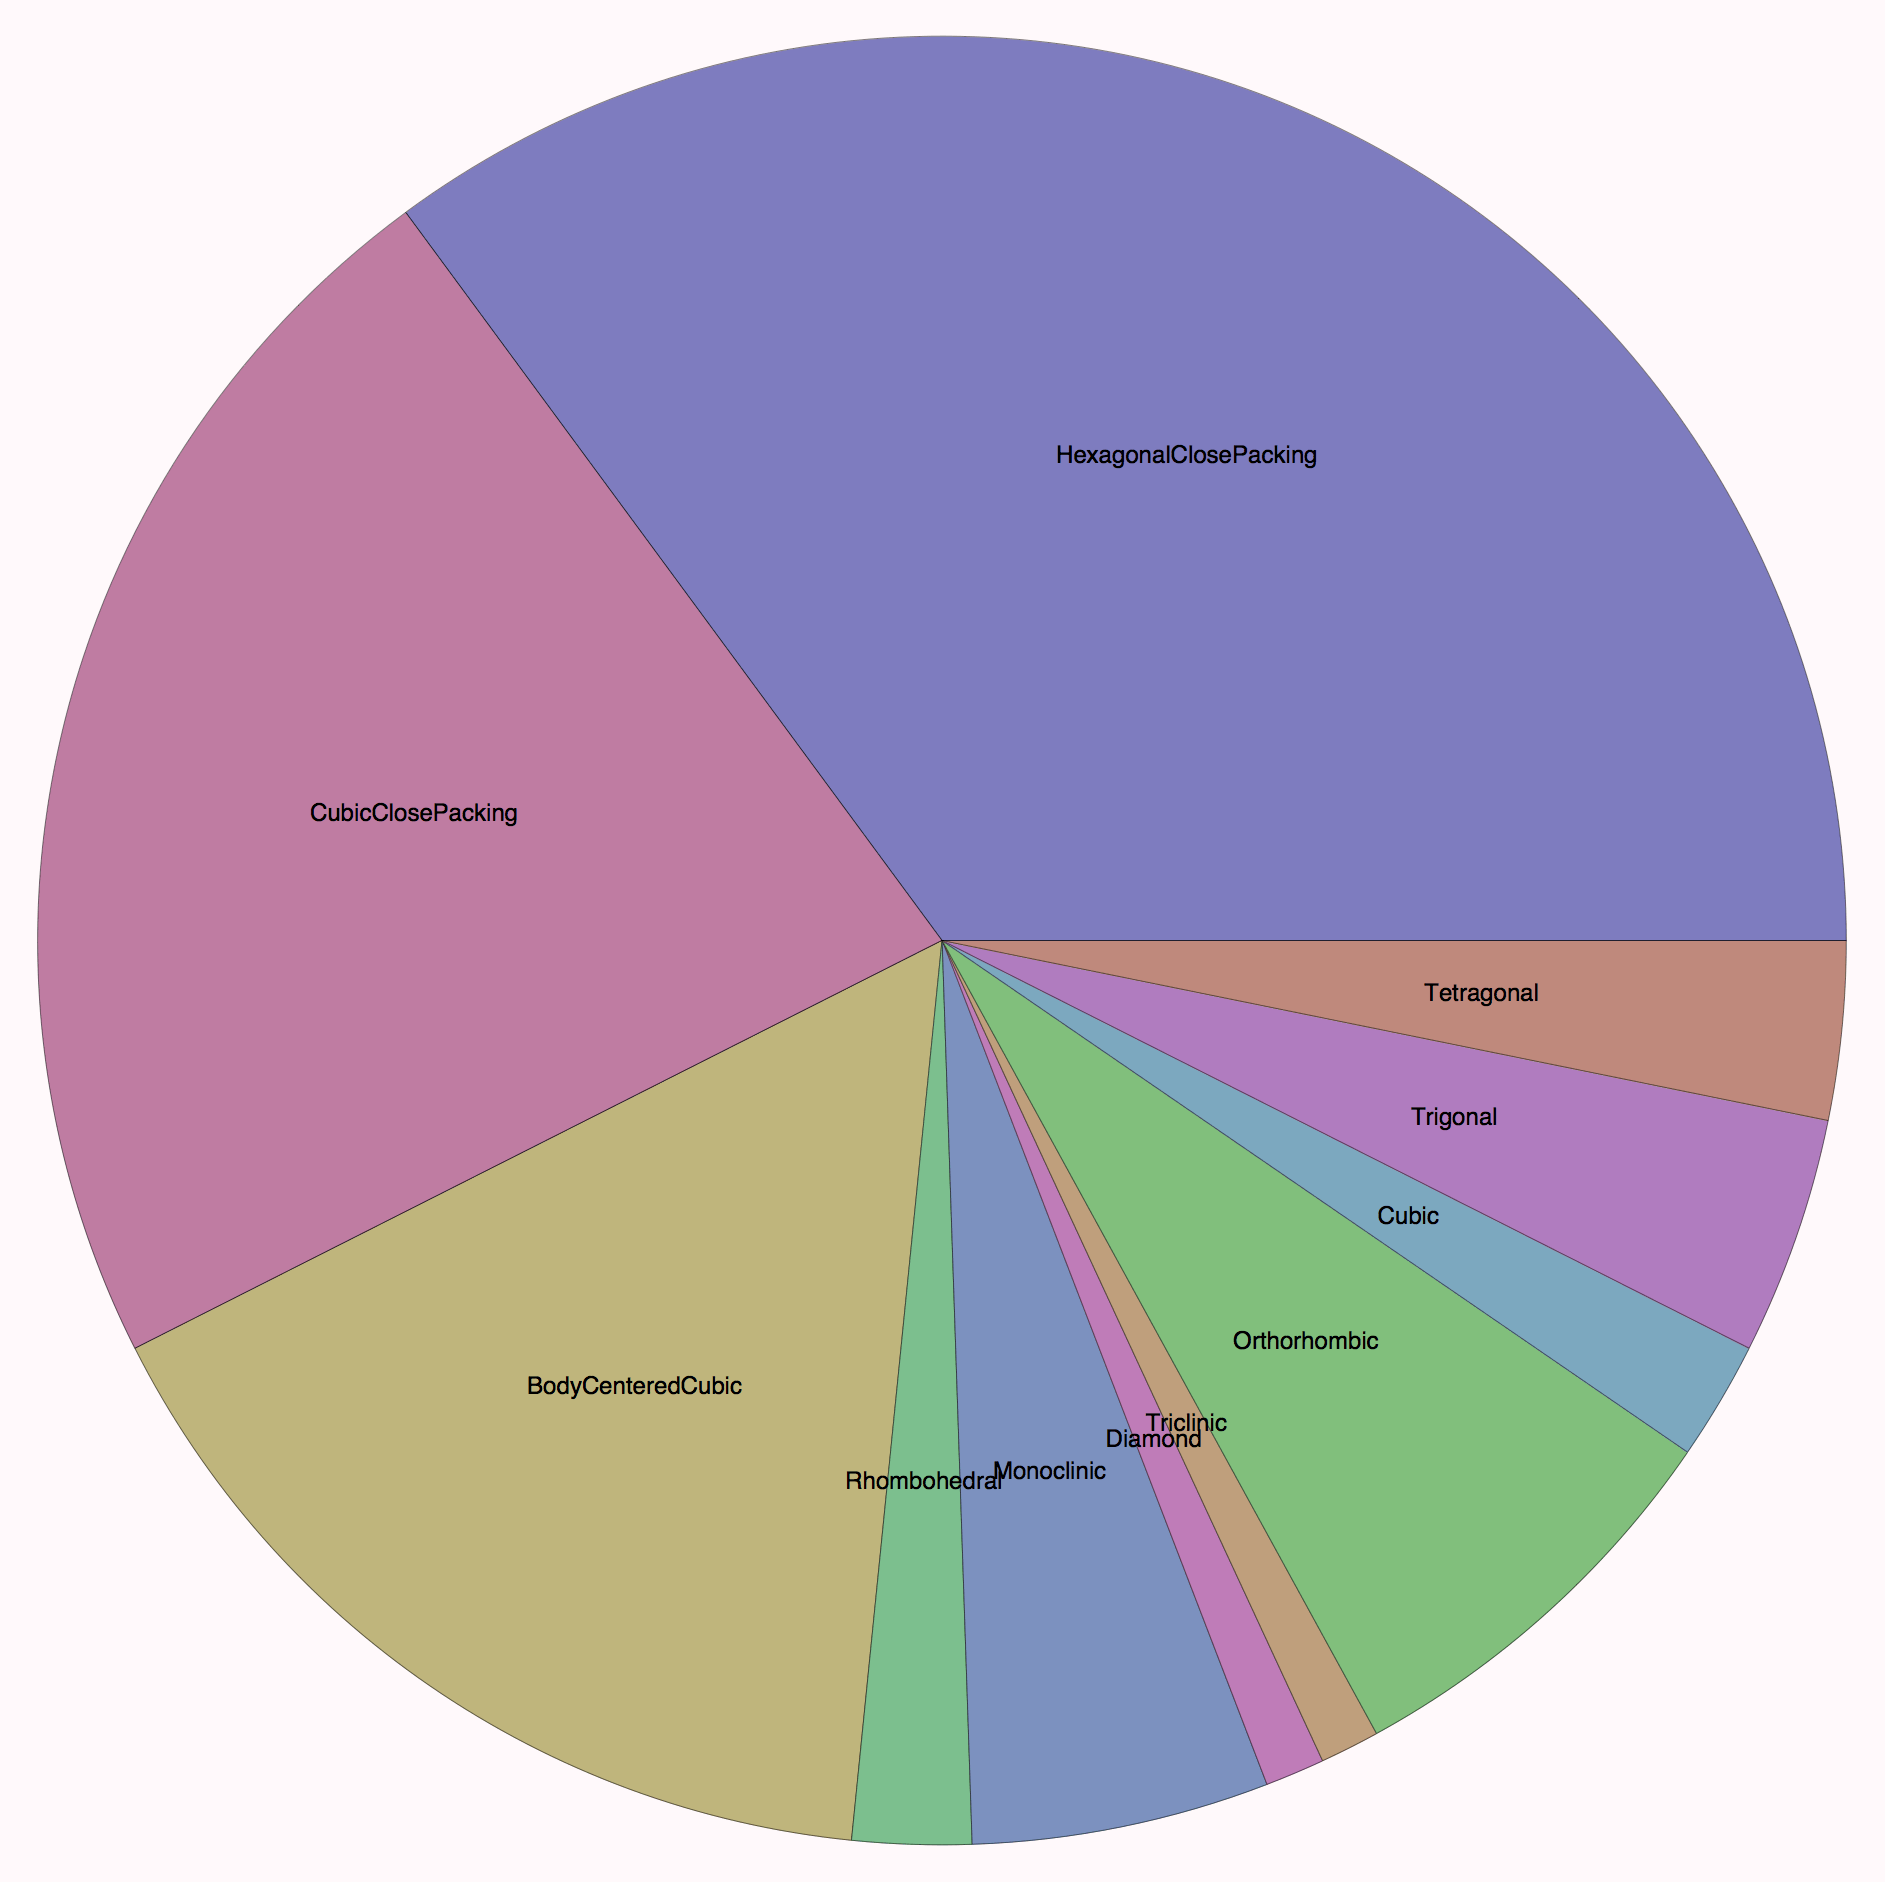
We do the same thing, but with a pie chart.

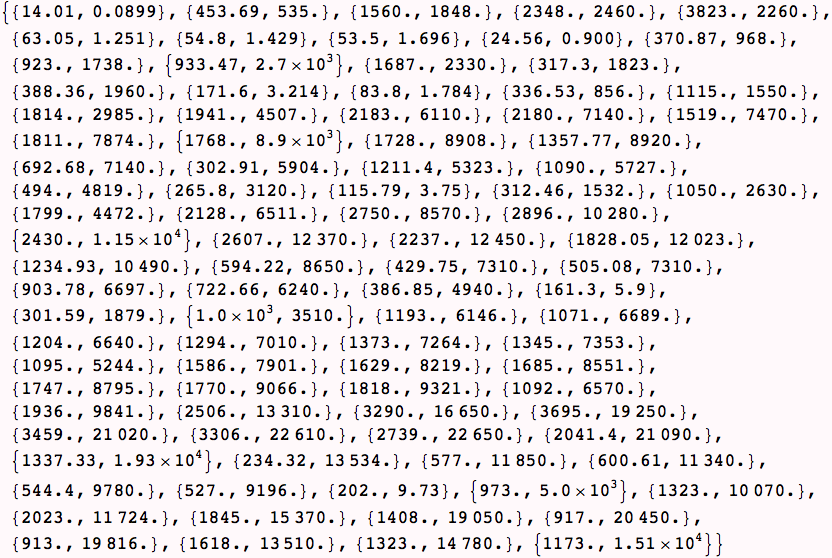
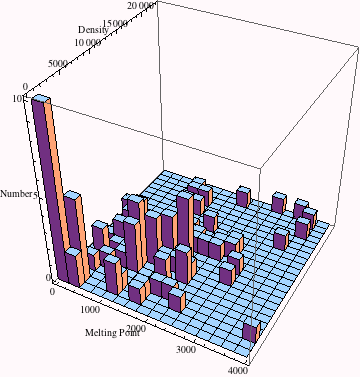
As a last example, we produce a 3D histogram. The height of each bar corresponds to the number of elements in a range of melting points and range of densities. We have to manipulate the data a bit to remove elements that have missing melting point OR density data.

| Created by Wolfram Mathematica 6.0 (28 August 2007) |