Plotting Data with Screen Interaction
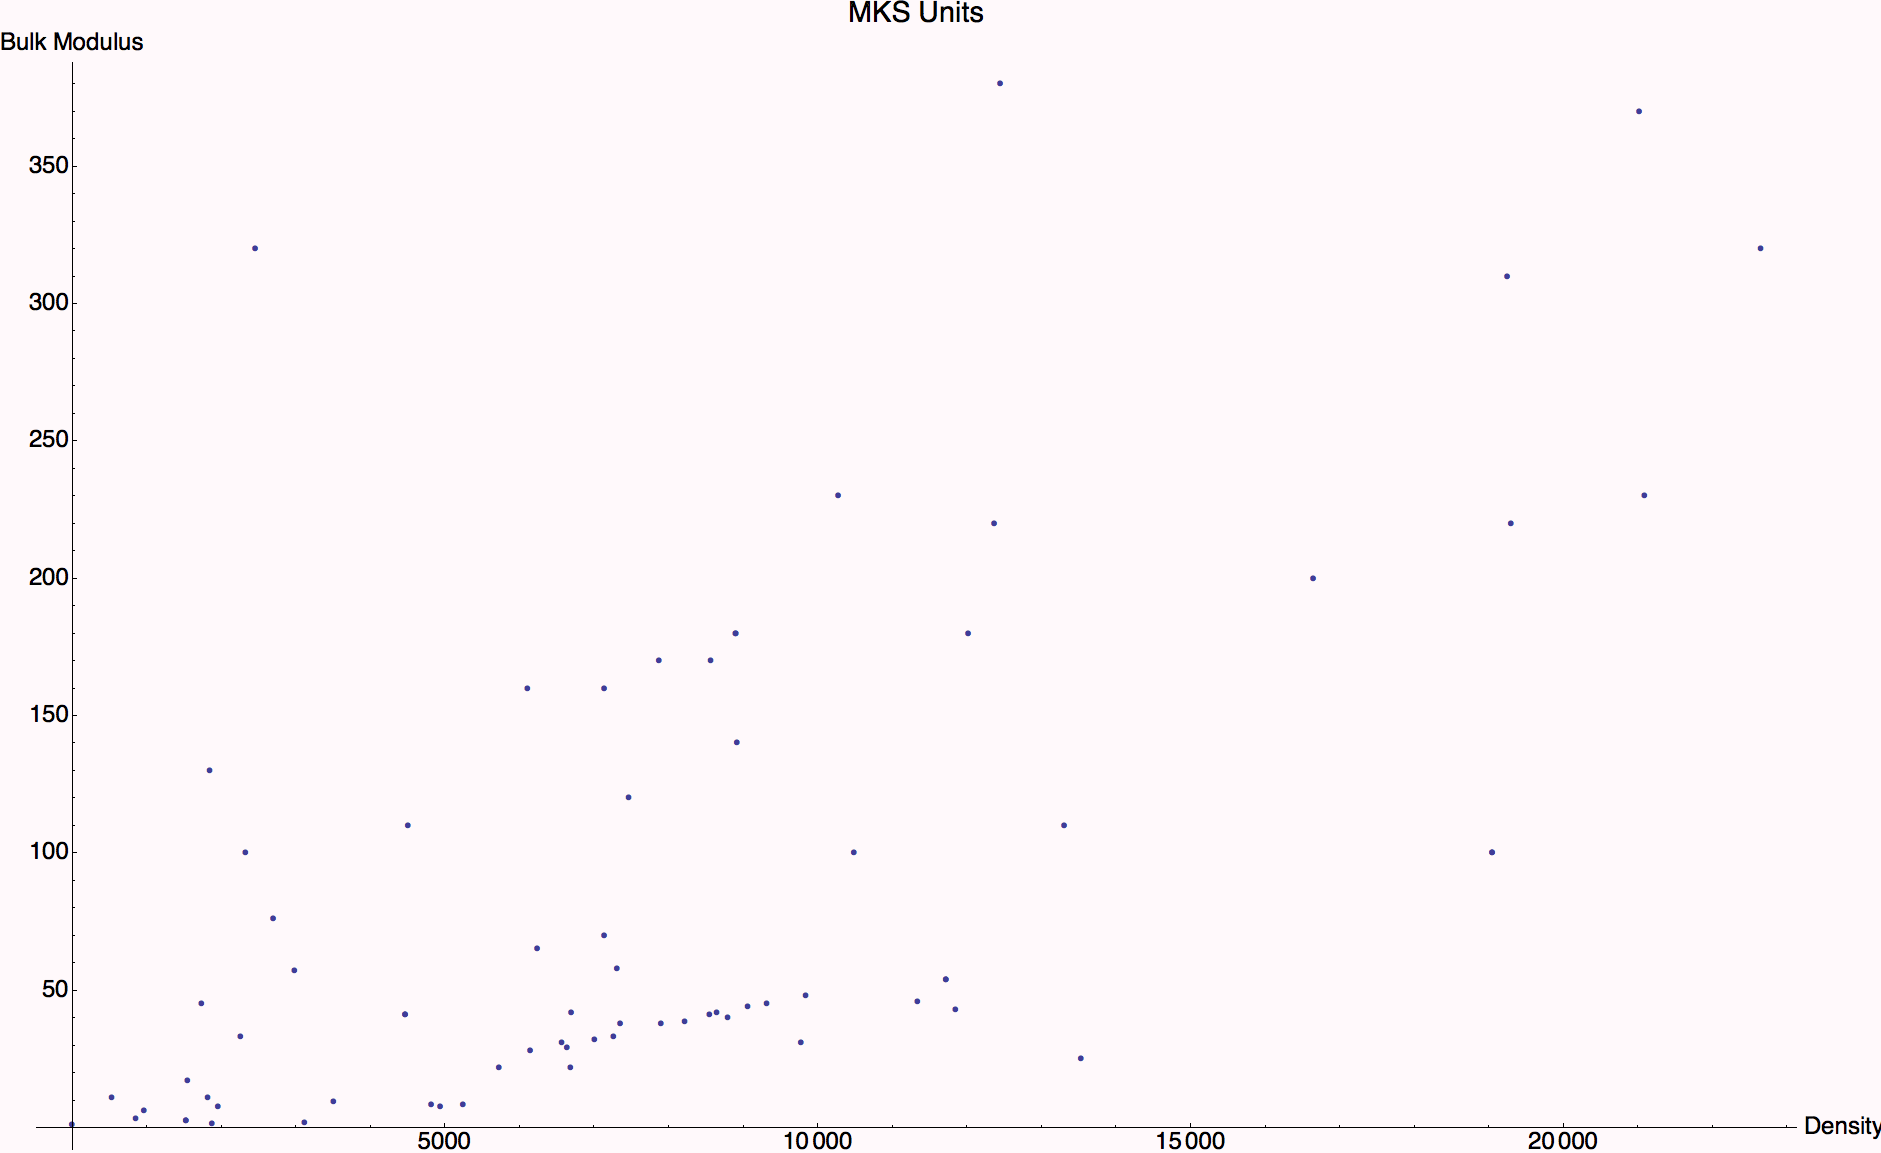
Example with Tooltip to make graphics interactive----put your mouse over a point and you get a pop-up with more information


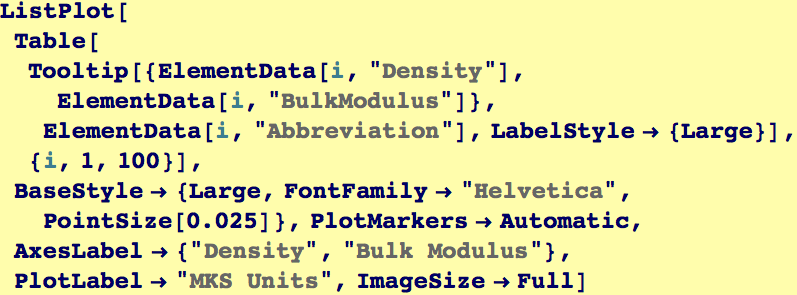
This is a slightly more complicated example of Tooltip. We create a data structure with {x(i),y(i)} = {density(i), bulkmodulus(i)} and then tell Tooltip to pop-up the element's symbol when the mouse is over it.


| Created by Wolfram Mathematica 6.0 (28 August 2007) |