Plotting Data
ListPlot, PieChart, Histogram, Barchart, etc
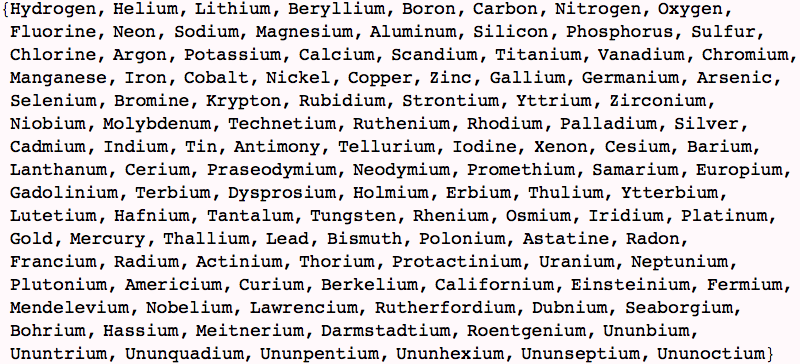
The next command uses Mathematicas Integrated Data Resources, it will not retrieve the data unless you have an active internet connection
![]()
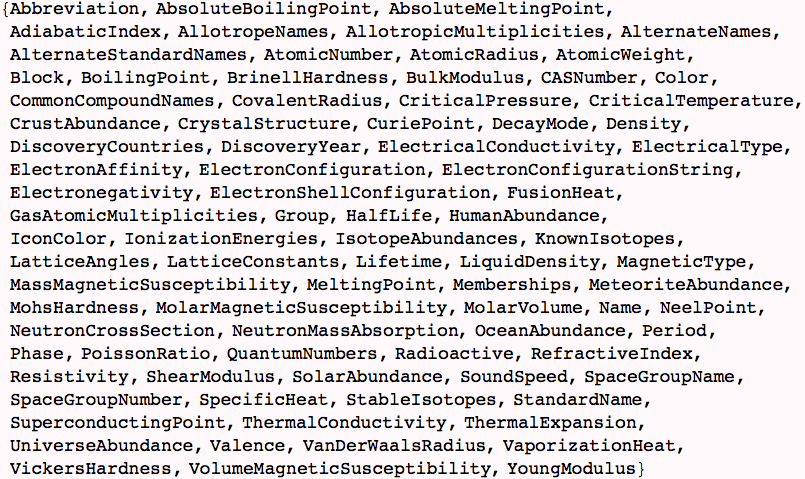
Here is a list of properties that we can access from ElementData
![]()
However, one should always question the provenence and accuracy of data... Let's make a sanity check: the stable phase of carbon at STP is graphite which is hexagonal (but not close packed).

![]()
![]()
We create a list of the densities of the first one hundred elements. Data that is missing is reported with Missing[NotAvailable] or Missing[Unknown].
![]()
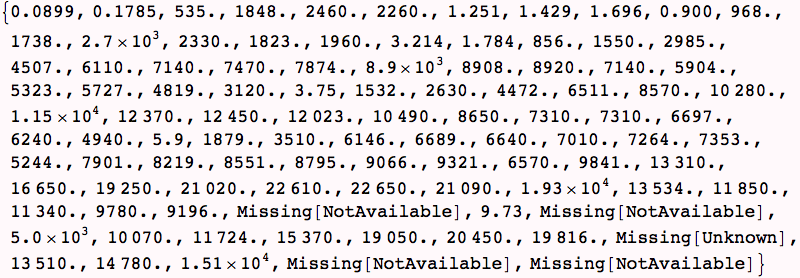
The data can be plotted with ListPlot
![]()
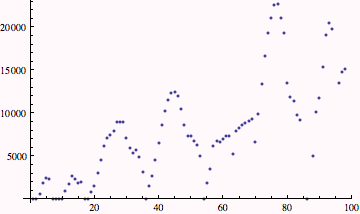

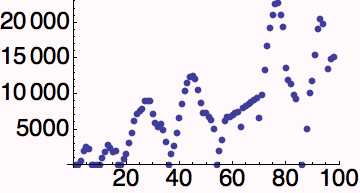
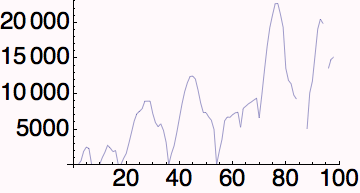
To join the data, one can use either ListLinePlot or use the Option "Joined → True" in ListPlot.

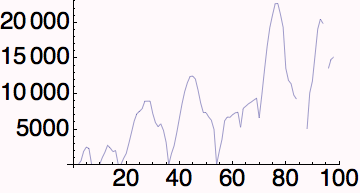
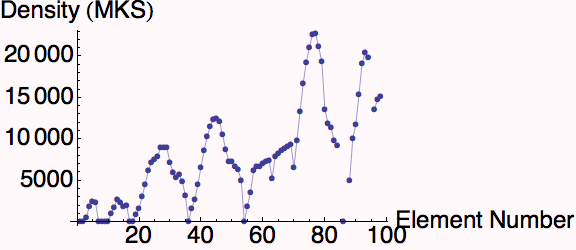
To see the data, we use the PlotMarkers Option.

| Created by Wolfram Mathematica 6.0 (28 August 2007) |