Plotting Parametric Curves
ParametricPlot can produce a 2-D graph as a function of a single parameter, e.g. t. The cartesian coordinates, e.g. x and y, are specified as functions x(t) and y(t). Thus, a continuous variation of the single parameter t will trace out a trajectory in the x-y plane. If two parameters are given, then ParametricPlot will fill the region x(r,t), y(r,t).
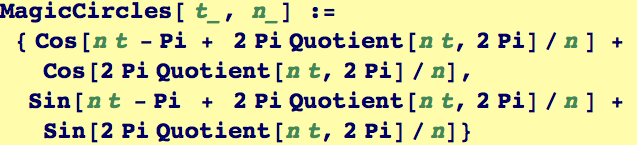
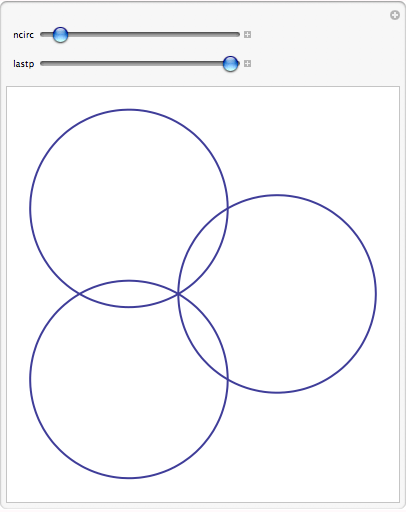
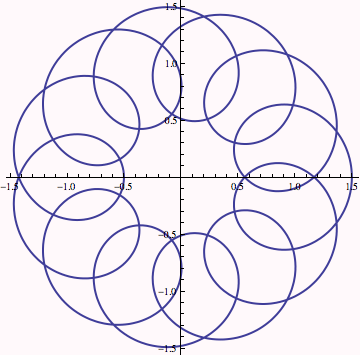
Let's create a function that returns a list {x(t), y(t)} as a function of its argument t. We add a parameter n to make things interesting to look at...
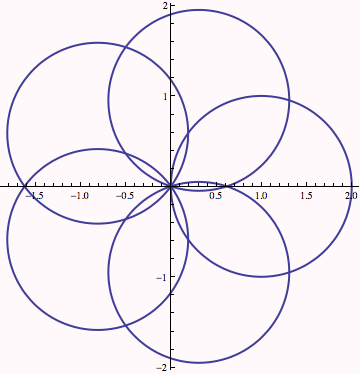
We use ParametricPlot on our function for n=5

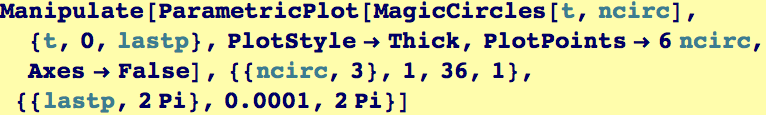
We can use Manipulate to view how the plot changes with the parameter n, and also change the last point drawn to see how the curve gets traced out.
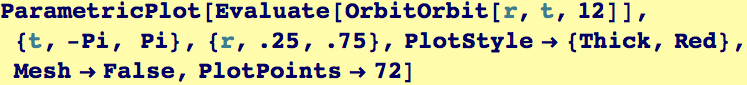
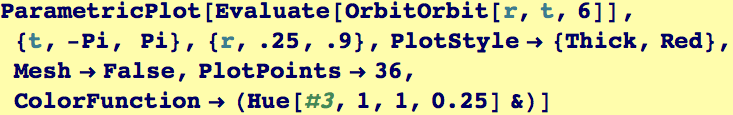
To demonstrate Parametrtic plot of a region, let's create a function that returns a list {x(r,t), y(r,t)} as a function of its arguments r and t. We add a parameter n to make things interesting to look at...

If we fix r, this is a one dimensional curve as above.

Now we let both r and t vary. Some regions in the disk r ∈ (0.25,0.75) don't get covered, and others get covered one or more times.
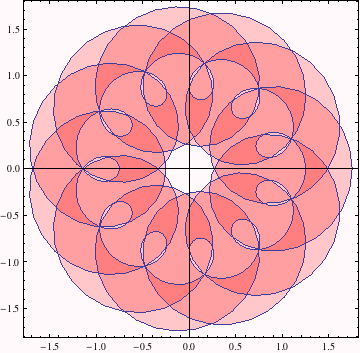
Just to demonstrate a pretty picture and to show what kinds of things are possible without going into details, we use a Pure Function as the ColorFunction option.
| Created by Wolfram Mathematica 6.0 (28 August 2007) |