Worked Animation Example with Graphics Primitives: Visualizing the Random Walk
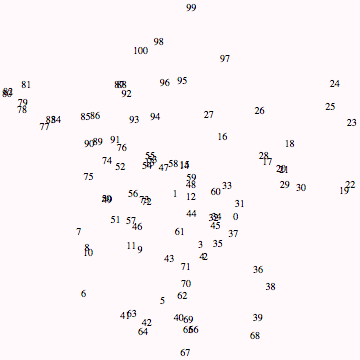
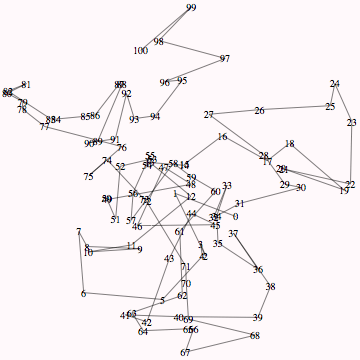
Many processes in the natural world can be modelled by random walks. An example is the trajectory of a particular molecule in a gas at low pressure. The next few lines of code produce random walks and display them graphically:
![]()
![]()
![]()

![]()
![]()
Create a function that returns a graphic object putting the step number at the correct place:


Create a function that returns a graphic object connecting a line between the current position and the previous.


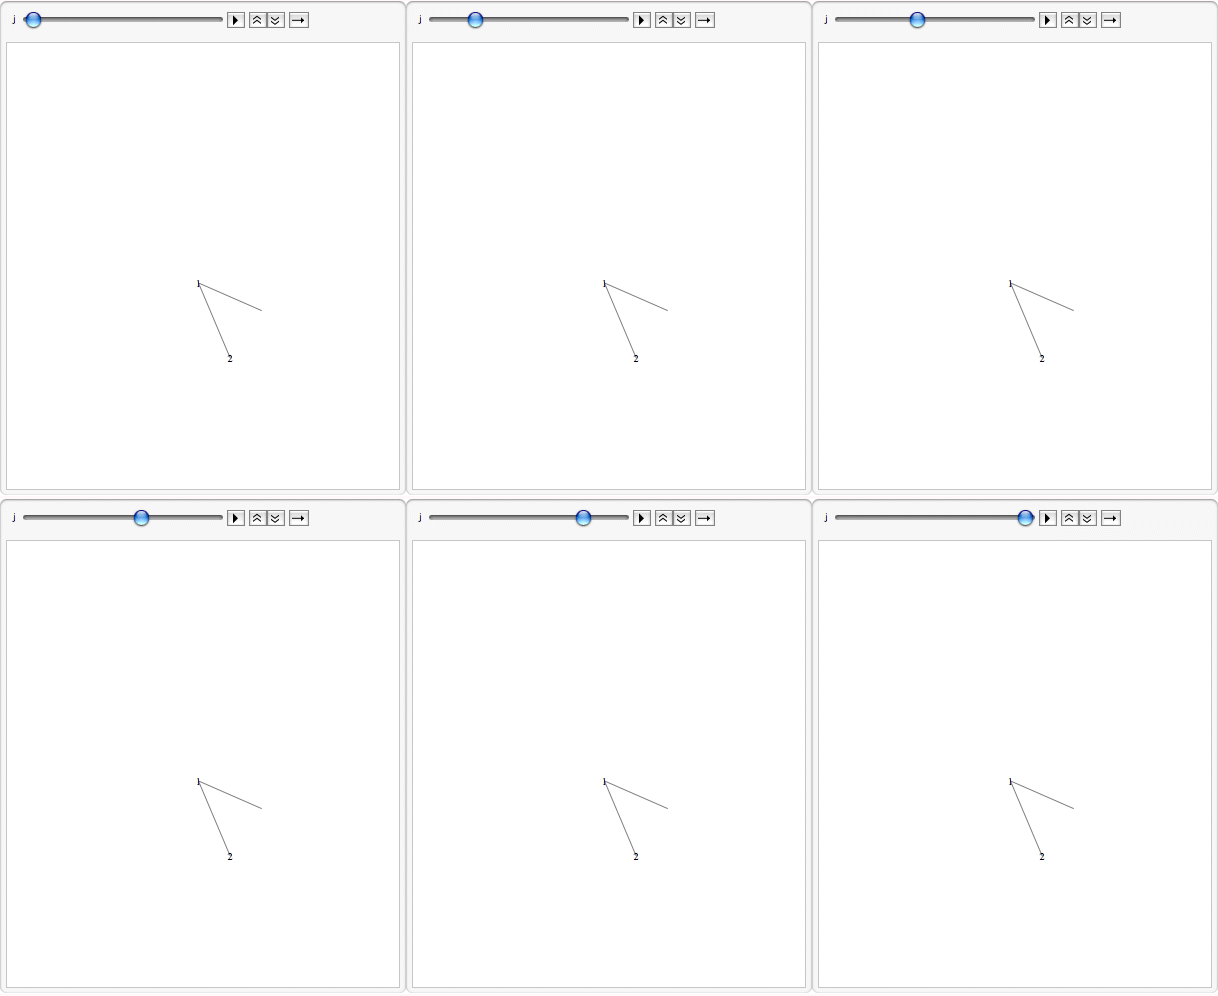
We can animate the jumps, but the result will not be satisfactory because each frame will be a different size...
![]()

If we use the PlotRange from a graphical object that contains all the points, we can fix the framesize, we use AbsoluteOptions
![]()
![]()


The animation is more satisfactory if we include the history... here we create a table of objects leading up to the current step.


| Created by Wolfram Mathematica 6.0 (28 August 2007) |