Fourier Theory and Fourier Transforms
Discrete Fourier Transforms on very simple lattices
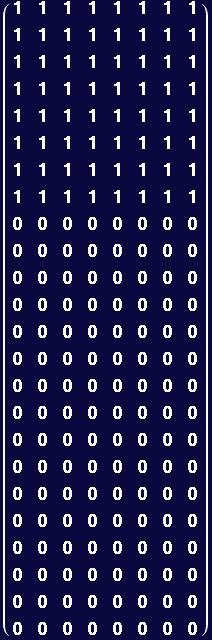
Create a simple lattice to upon which a fourier transform will taken
In[217]:=
Out[219]//MatrixForm=
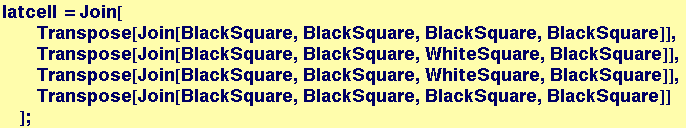
Example of construction of a slightly larger structure
In[220]:=
Visualize structure:
In[221]:=
![[Graphics:HTMLFiles/Lecture-18_7.gif]](HTMLFiles/Lecture-18_7.gif)
The following duplicates an input matrix and creates ![]() copies alligned in a column:
copies alligned in a column:
In[222]:=
example:
In[223]:=
![]()
![[Graphics:HTMLFiles/Lecture-18_11.gif]](HTMLFiles/Lecture-18_11.gif)
Out[223]=
![]()
The following duplicates an input matrix and create ![]() copies alligned in a row
copies alligned in a row
In[224]:=
![]()
example:
In[225]:=
![]()
![[Graphics:HTMLFiles/Lecture-18_16.gif]](HTMLFiles/Lecture-18_16.gif)
Out[225]=
![]()
Create a 256 by 256 data set
In[226]:=
![]()
Function to create graphics for delayed display
In[227]:=
In[229]:=
![]()
Example
In[230]:=
![]()
Out[230]=
![]()
To see the data:
In[231]:=
![[Graphics:HTMLFiles/Lecture-18_25.gif]](HTMLFiles/Lecture-18_25.gif)
Out[231]=
![]()
Take Discrete Fourier Transform of constructed simple lattice
In[232]:=
Create Image of Fourier Transform (Here a special color function is used (but not really explained). Red is high intensity, blue is low, gray is roughly zero)
Abs is used to get intensities of spots at each of the N×M wavevectors
In[233]:=
In[236]:=
![]()
Out[236]=
![]()
Show original,its Fourier Transform (FT), and the FT the FT:
Use Chop to remove small spurious imaginary values. Because the lattice is very perfect, the fourier spots are very small. One could use the magnification feature to improve the visibility of the spots.
In[237]:=
![[Graphics:HTMLFiles/Lecture-18_34.gif]](HTMLFiles/Lecture-18_34.gif)
Out[237]=
![]()
Some notes on the plots above: The spot pattern in the Fourier transform extends over the entire pane but is hard to resolve except around the perimeter. Note periodic array of sharp spots in the Fourier transform, and note that there are some "missing" columns of spots that also repeat periodically. Note that the Fourier transform of the Fourier transform reconstructs the orignial object quite faithfully.
Microscopists are used to seeing the "k=0" point in the center of the fourier image (i.e., the periodic information at the center). We can write a function that translates the k=0 point to the center of the image and redisplay the result:
In[238]:=
Out[241]=
![]()
![[Graphics:HTMLFiles/Lecture-18_42.gif]](HTMLFiles/Lecture-18_42.gif)
Out[242]=
![]()
Create a function to create a defect in the lattice...(there will be a small portion of the white rectangle at the lower left that is missing; otherwise the object will be the same as above).
In[243]:=
![]()
![]()
![]()
In[244]:=
![]()
Create template for defect creation
In[245]:=
![]()
Recreate Images and Redisplay
In[246]:=
![]()
![]()
![]()
![]()
![]()
Note curious result that the position of the defect has changed to a symmetric position in the reconstructed image
In[251]:=
![[Graphics:HTMLFiles/Lecture-18_55.gif]](HTMLFiles/Lecture-18_55.gif)
Out[251]=
![]()
Note above that the Fourier transform continues to have the sharp spots associated with the perfect crystal, but that "diffuse" intensity (colored contours) now arises throughout reciprocal space. The details of the diffuse intensity distribution contain information about the structure of the defect. Once again, except for orientation, the "backtransform" gives a very accurate reconstruction of the original.
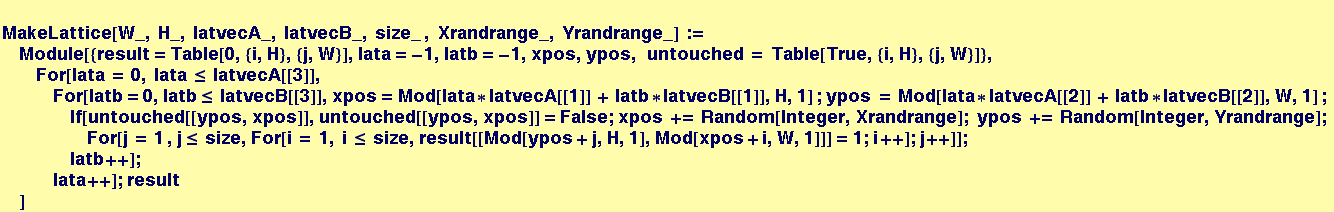
Visualization of the Fourier Transform of a lattice that has a little "thermal" noise in the lattice positions
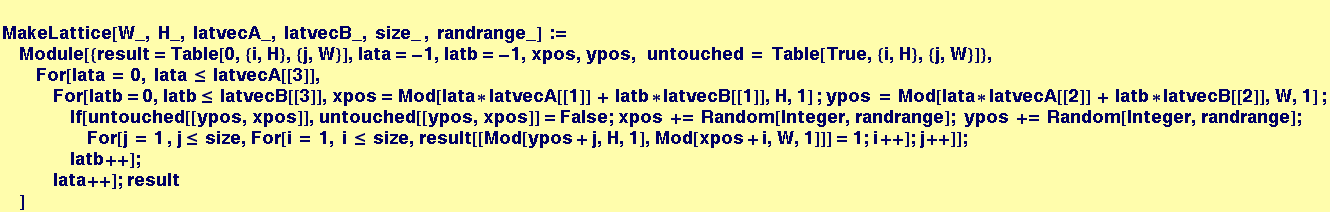
Function to make a square with a specified size, with a lattice composed of lattice vectors:
MakeLattice[Width, Height, {![]() ,
, ![]() , repeats}, {
, repeats}, {![]() ,
, ![]() , repeats}, AtomSize, {noise_back, noise_forward}]
, repeats}, AtomSize, {noise_back, noise_forward}]
Function is not ideal, works best when the lattice vectors are perfect divisors of the width and height
In[252]:=
![]()
![]()
![]()
![]()
Example of a lattice with no noise:
In[253]:=
![]()
In[254]:=
![]()
![[Graphics:HTMLFiles/Lecture-18_68.gif]](HTMLFiles/Lecture-18_68.gif)
Out[254]=
![]()
Make identical lattice, but add a little noise to the system:
The noise is simulated by making small random displacements of each "atom" about its site in the perfect crystal, then computing the Fourier transform of the resulting somewhat imperfect crystal...
In[255]:=
![]()
Visualization of the original image, its fourier transform, and them inverse fourier transform of the fourier transform..
In[256]:=
![]()
![[Graphics:HTMLFiles/Lecture-18_72.gif]](HTMLFiles/Lecture-18_72.gif)
Out[256]=
![]()
Notes on these images: The periodic array of spots seen in previous Fourier transforms from "crystals" are not visible here, but they are present. Once again, the imperfection of the object gives rise to a distribution of "diffuse" intensity in reciprocal space. Careful observation indicates that the back-transform on the right is rotated 180° with respect to the original, as in the example above that contained the single defect.
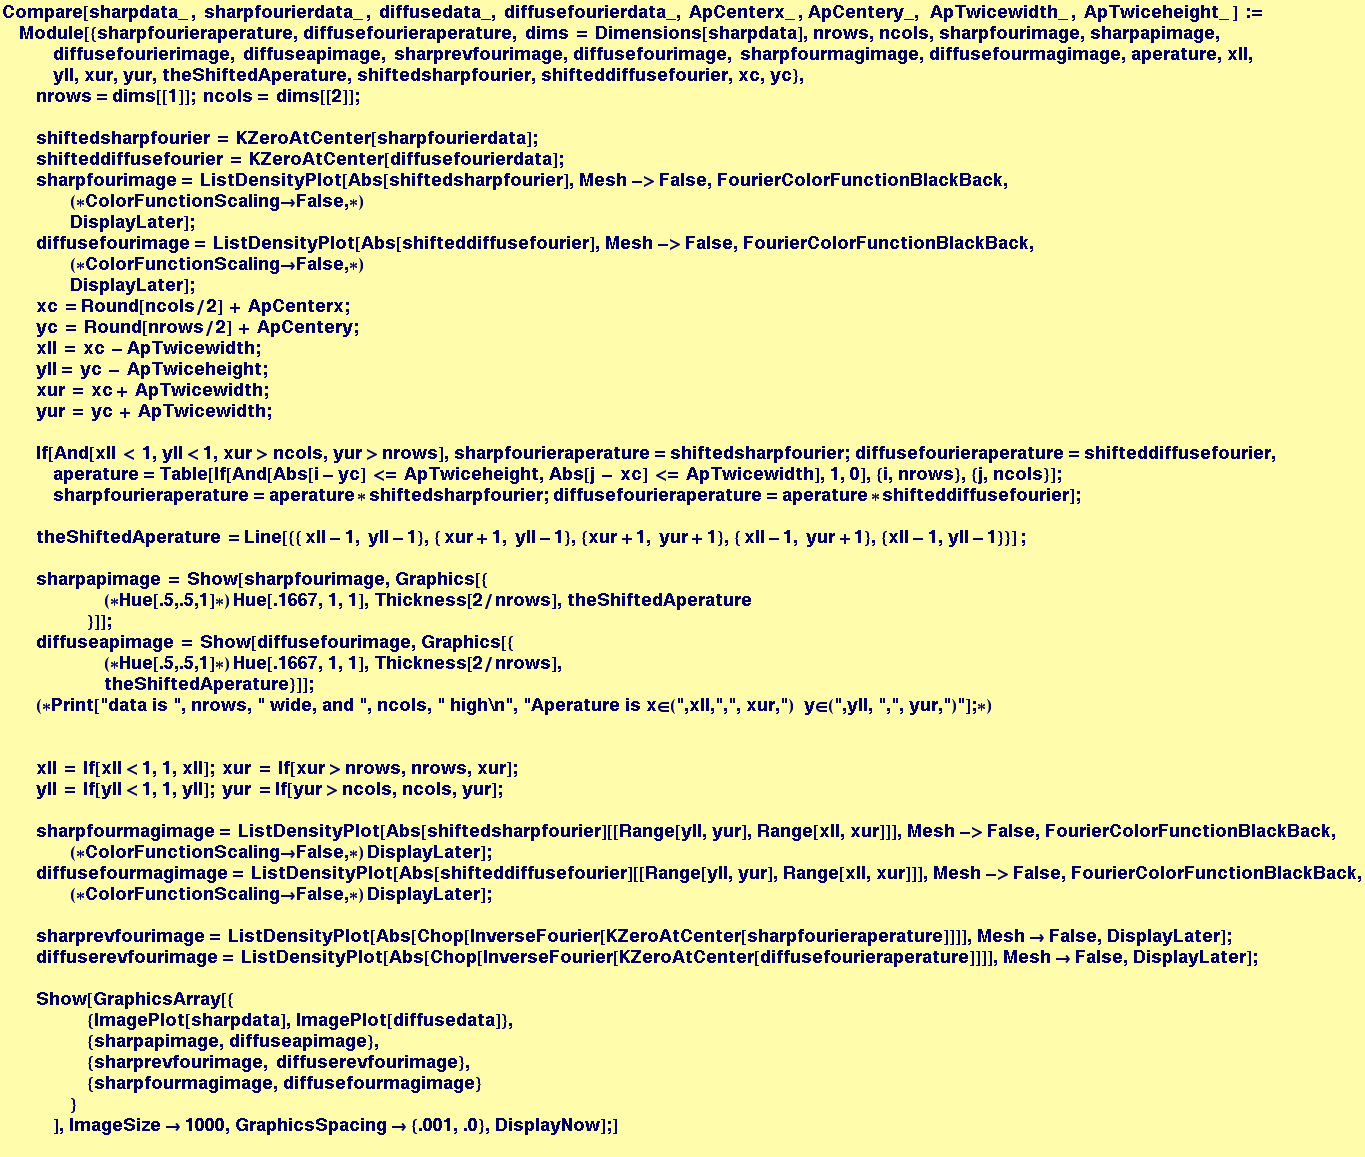
Using an Aperature to look at a particular region of reciprocal space and visualizing its effect
The following is a fairly baroque function to do something what is conceptually straightforward:
The function takes original data from a lattice and its fourier transform and graphically compares those to data from a "noised-up" lattice.
The function allows the user to specify the center of the aperature in reciprocal space as well as (twice) the aperature width and height.
The function will display eight images in two columns. The left column of graphics illustrates (from top to bottom)the "clean" input image, the entire fourier transform with the rectangular aperature illustrated, the "reconstructed image" that derives from the fourier transform of the aperature region, and finally a magnified image of the fourier transform within the aperature only.
The right column is the same sequence of images for the "noised-up" initial data
Compare[] takes 8 arguments:
The first four are 1) The input discrete lattice reference data
2) The fourier transform of the input reference data
3) The input "perturbed" data
4) The fourier transform of the perturbed data
The second four are
1-2) the x and y lattice coordinates of the center of the square "aperature" in fourier space (0,0) is the center and the
edge depends on the size of the data.
3-4) twice the width and height of the aperature.
In[257]:=
An example, use MakeLattice to produce a "clean" and a "noised-up" lattice
In[258]:=
![]()
![]()
In[260]:=
![]()
In[261]:=
![]()
![[Graphics:HTMLFiles/Lecture-18_79.gif]](HTMLFiles/Lecture-18_79.gif)
![]()
In[262]:=
![]()
![[Graphics:HTMLFiles/Lecture-18_82.gif]](HTMLFiles/Lecture-18_82.gif)
In[263]:=
![]()
![[Graphics:HTMLFiles/Lecture-18_84.gif]](HTMLFiles/Lecture-18_84.gif)
In[264]:=
![]()
![[Graphics:HTMLFiles/Lecture-18_86.gif]](HTMLFiles/Lecture-18_86.gif)
In[265]:=
![]()
![[Graphics:HTMLFiles/Lecture-18_88.gif]](HTMLFiles/Lecture-18_88.gif)
This suggests the (potentially) interesting exercise of modifying compare to take two aperature specifications to "pick out" other periodicities in the lattice--i.e., something like the following:
Compare[cleandata_ , fouriercleandata_ , noisydata_, fouriernoisydata_, {FirstApLowX_, FirstApHiX_ , FirstApLowY_, FirstApHiY_}, {SecondApLowX_,SecondApHiX_ , SecondApLowY_, SecondApHiY_}] :=
Consider what happens to the image when the noise is anisotropic... Modify the function MakeLattice to take two "noise arguments"
In[266]:=
The following data only has fluctuations in the up and down direction:
In[267]:=
![]()
The resulting Fourier transform gets "streaked" in the left and right direction
In[340]:=
![]()
![[Graphics:HTMLFiles/Lecture-18_92.gif]](HTMLFiles/Lecture-18_92.gif)
With the following aperature, we tend to pick out one lattice vector, but not the other
In[351]:=
![]()
![[Graphics:HTMLFiles/Lecture-18_94.gif]](HTMLFiles/Lecture-18_94.gif)
Fourier Transforms on Images
Importing an image into Mathematica, .gif is some of many graphics data types that Mathematica can process.
In[294]:=
In[295]:=
![]()
![[Graphics:HTMLFiles/Lecture-18_97.gif]](HTMLFiles/Lecture-18_97.gif)
Out[295]=
![]()
The gray values of this image are stored in the (1,1) position of the image with gray values in the range (0,255)
In[298]:=
![]()
In[299]:=
![]()
Out[299]=
![]()
In[300]:=
In[301]:=
![]()
![[Graphics:HTMLFiles/Lecture-18_104.gif]](HTMLFiles/Lecture-18_104.gif)
Out[301]=
![]()
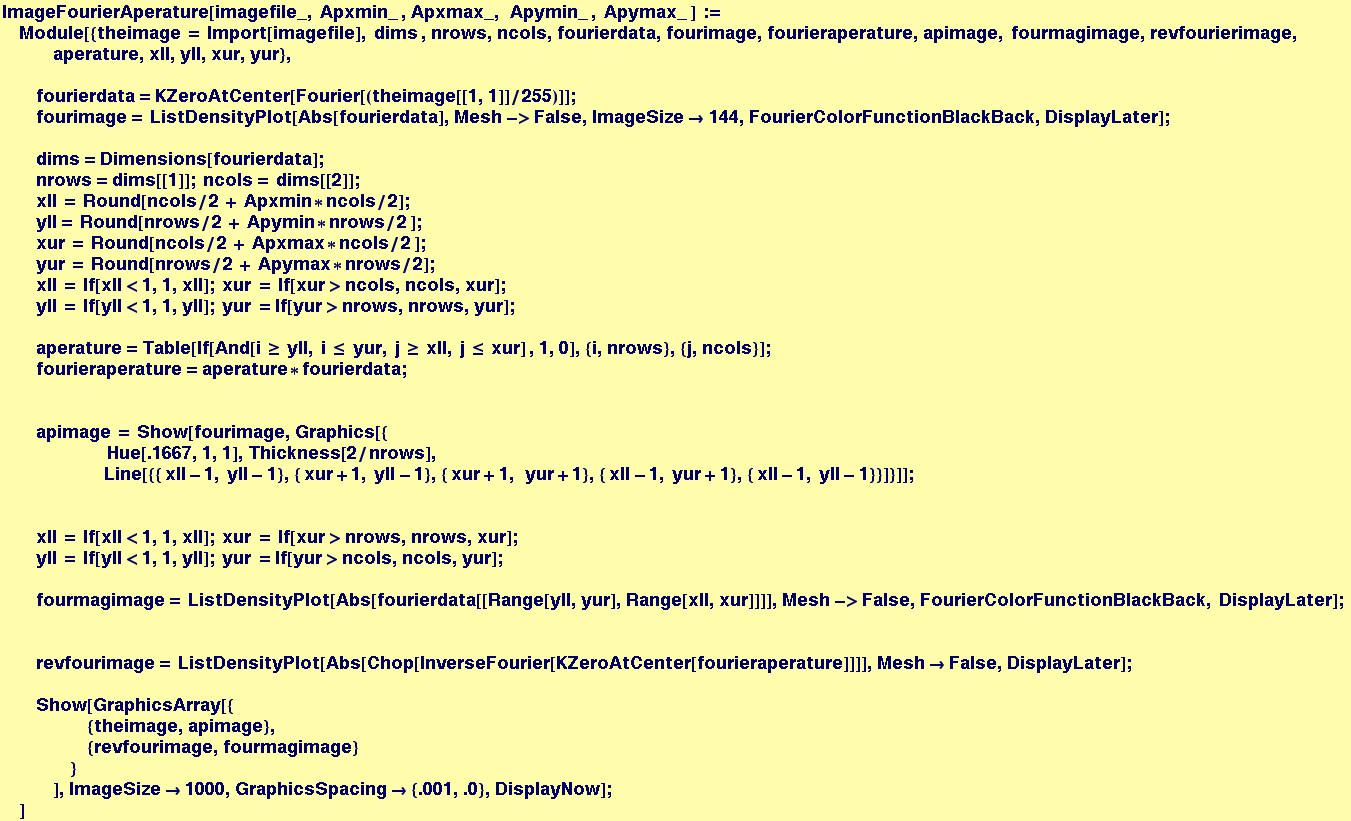
Write a function that takes a file as input, as well as an aperature specification, then displays the image, its transform and its reverse transform of the aperature fraction of the image
In[275]:=
In[303]:=
![]()
![[Graphics:HTMLFiles/Lecture-18_108.gif]](HTMLFiles/Lecture-18_108.gif)
In[304]:=
![]()
![[Graphics:HTMLFiles/Lecture-18_110.gif]](HTMLFiles/Lecture-18_110.gif)
In[307]:=
![]()
![[Graphics:HTMLFiles/Lecture-18_112.gif]](HTMLFiles/Lecture-18_112.gif)
In[308]:=
![[Graphics:HTMLFiles/Lecture-18_114.gif]](HTMLFiles/Lecture-18_114.gif)
In[309]:=
![]()
![[Graphics:HTMLFiles/Lecture-18_116.gif]](HTMLFiles/Lecture-18_116.gif)
In[311]:=
![[Graphics:HTMLFiles/Lecture-18_118.gif]](HTMLFiles/Lecture-18_118.gif)
In[312]:=
![[Graphics:HTMLFiles/Lecture-18_120.gif]](HTMLFiles/Lecture-18_120.gif)
The gray values of this image are stored in the (1,1) position of the image with gray values in the range (0,255)
In[319]:=
![]()
![[Graphics:HTMLFiles/Lecture-18_122.gif]](HTMLFiles/Lecture-18_122.gif)
In[330]:=
![]()
![[Graphics:HTMLFiles/Lecture-18_124.gif]](HTMLFiles/Lecture-18_124.gif)
In[333]:=
![]()
![[Graphics:HTMLFiles/Lecture-18_126.gif]](HTMLFiles/Lecture-18_126.gif)
In[326]:=
![]()
![[Graphics:HTMLFiles/Lecture-18_128.gif]](HTMLFiles/Lecture-18_128.gif)
In[329]:=
![]()
![[Graphics:HTMLFiles/Lecture-18_130.gif]](HTMLFiles/Lecture-18_130.gif)
In[334]:=
![]()
![[Graphics:HTMLFiles/Lecture-18_132.gif]](HTMLFiles/Lecture-18_132.gif)
In[338]:=
![]()
![[Graphics:HTMLFiles/Lecture-18_134.gif]](HTMLFiles/Lecture-18_134.gif)
In[339]:=
![]()
![[Graphics:HTMLFiles/Lecture-18_136.gif]](HTMLFiles/Lecture-18_136.gif)
| Created by Mathematica (November 3, 2005) |